Multiple Choice
The scatterplots show the relation between the average phenotype of parents (x-axis) and that of their offspring (y-axis) for two traits in a variety of tropical sweet corn. One trait is ear height, which has a heritability of 75%; and the other is ear length, which has a heritability of 25%. To make the axes comparable, for each trait the phenotypic measurement is expressed as a deviation from the overall mean in multiples of the standard deviation. Which of the following matchups is CORRECT? 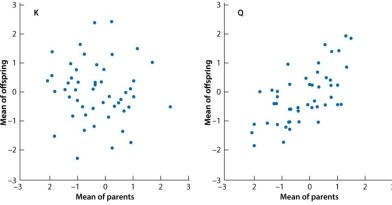
A) Ear length is trait K and ear height is trait Q.
B) Ear length is trait Q and ear height is trait K.
C) Ear length and ear height are both trait K.
D) Ear length and ear height are both trait Q.
Correct Answer:

Verified
Correct Answer:
Verified
Q53: Salt intake is associated with an increased
Q54: Consider a trait determined by a rare,
Q55: Personalized medicine matches the treatment to the
Q56: Diets high in fat and carbohydrates affect
Q57: Lindsay and Joy are twins that share
Q59: Which of the traits depicted here has
Q60: Personalized medicine matches the treatment to the:<br>A)insurance.<br>B)hospital.<br>C)disease.<br>D)phenotype.<br>E)genotype.
Q61: One reason that the effects of individual
Q62: Consider Figure 18.11, below, which shows the
Q63: Consider a simple Mendelian trait that is