Multiple Choice
In the graph of Galton's height data below, which line on the graph represents the population mean? 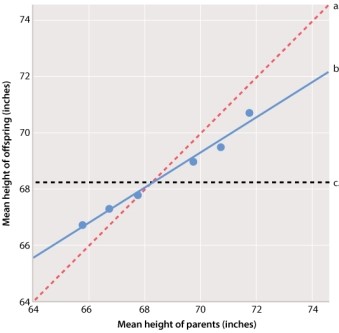
A) line a
B) line b
C) line c
Correct Answer:

Verified
Correct Answer:
Verified
Related Questions
Q67: Five varieties of hybrid corn are studied
Q68: Red coloration in wheat seeds is a
Q69: Sunlight exposure has stronger effect on skin
Q70: Identification and location of genes on chromosomes
Q71: Inbred lines show:<br>A)no phenotypic variation.<br>B)phenotypic variation due
Q73: A premise of personalized medicine is that
Q74: Clustering of genes with related functions on
Q75: An example of "regression toward the mean"
Q76: Some tentative patterns that are emerging from
Q77: The phenotypes of complex traits vary with