Multiple Choice
In the graph of Galton's height data below, which line on the graph represents the mean height of the offspring for a given average height of the mother and father? 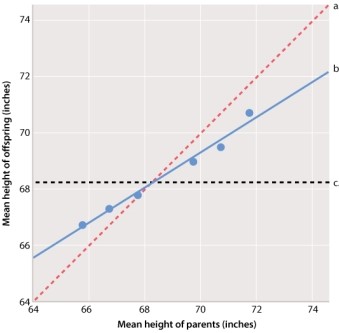
A) line a
B) line b
C) line c
Correct Answer:

Verified
Correct Answer:
Verified
Related Questions
Q154: Fraternal twins arise from two different fertilized
Q155: A trait with high heritability responds rapidly
Q156: When studying phenotypic variations due to the
Q157: You study a complex trait in the
Q158: Heritability applies only to the traits in
Q159: A trait with high heritability will respond
Q160: Inbred lines are:<br>A)possible only in plants.<br>B)possible only
Q162: Similar to single gene traits, traits determined
Q163: A farmer in Kansas and a farmer
Q164: When the average weight of the parents