Multiple Choice
Table 1
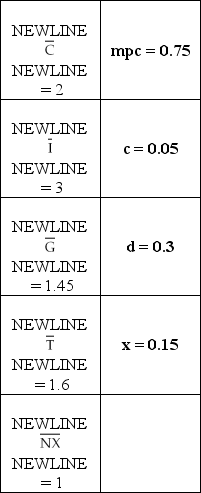
-Given the values in the table above, equilibrium output Y = ________ when the real interest rate r = 4.
A) 26.6
B) 0.65
C) 17
D) 5.65
E) none of the above
Correct Answer:

Verified
Correct Answer:
Verified
Q10: If planned expenditure is below output,as the
Q16: In the IS model, assuming that the
Q17: The reason for the downward-sloping IS curve
Q19: Total aggregate demand includes _.<br>A)planned investment spending<br>B)consumption
Q42: Planned investment spending _.<br>A)is equal to planned
Q49: When the U.S.real interest rate rises _.<br>A)U.S.dollar
Q57: The consumption function shows how _.<br>A)the marginal
Q82: IS Graph 2 <img src="https://d2lvgg3v3hfg70.cloudfront.net/TB5036/.jpg" alt="IS Graph
Q84: Assume that households decide to save more,so
Q97: In the IS model,assuming that the real