Multiple Choice
Figure 6.1 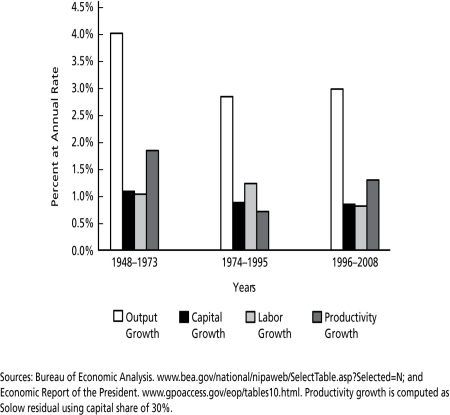
-According to Figure 6.1, the average annual rate of growth of the U.S. economy in the period 1996-2008 equalled ________.
A) 0.3 percent.
B) 3.0 percent.
C) 30 percent.
D) 300 percent.
Correct Answer:

Verified
Correct Answer:
Verified
Q4: Productivity growth can be measured _.<br>A)by dividing
Q6: Other things the same,in the Solow model
Q17: Solow Diagram <img src="https://d2lvgg3v3hfg70.cloudfront.net/TB5036/.jpg" alt="Solow Diagram
Q23: "Capital dilution" refers to _.<br>A)the flow of
Q24: Strong evidence of convergence exists for _.<br>A)wealthy
Q37: In theory,differences in output across economies and
Q43: If an economy invests more than it
Q46: Which of the following had the highest
Q52: A major contribution of the Solow model
Q61: Figure 6.1 <img src="https://d2lvgg3v3hfg70.cloudfront.net/TB5036/.jpg" alt="Figure 6.1