Multiple Choice
Figure 6.1 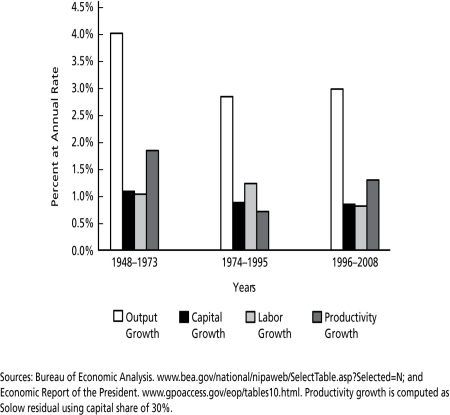
-In Figure 6.1, the post-World War II "baby boom" is reflected in the growth of ________.
A) labor input from 1974 - 1995
B) labor input from 1948 - 1973
C) output from 1948 - 1973
D) capital input from 1996 - 2008
Correct Answer:

Verified
Correct Answer:
Verified
Q15: When an economy experiences a one-time increase
Q31: The loss of capital due to the
Q48: Other things the same,in the Solow model
Q62: If productivity is growing at some sustained
Q64: Within rich economies,there is strong evidence of
Q66: Figure 6.1 <img src="https://d2lvgg3v3hfg70.cloudfront.net/TB5036/.jpg" alt="Figure 6.1
Q68: The economic growth of the United States
Q74: Consumption per worker is 72, depreciation is
Q74: Productivity is _.<br>A)determined by central bank policy<br>B)the
Q81: According to the Solow model,a benefit of