Multiple Choice
12.2 Equilibrium in Aggregate Demand and Supply Analysis
AD - AS Equilibrium 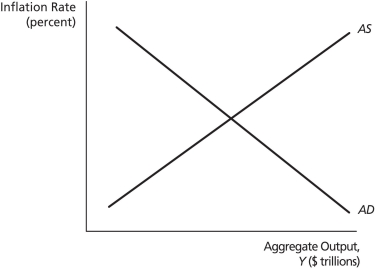
-On the graph above,if output is falling,while the quantity demanded is rising,the economy may be at a point on ________.
A) the aggregate supply curve above the aggregate demand curve
B) the aggregate supply curve below the aggregate demand curve
C) the aggregate demand curve above the aggregate supply curve
D) the aggregate demand curve below the aggregate supply curve
E) none of the above
Correct Answer:

Verified
Correct Answer:
Verified
Q71: AD - AS Shocks <img src="https://d2lvgg3v3hfg70.cloudfront.net/TB5036/.jpg" alt="AD
Q72: AD - AS Shocks <img src="https://d2lvgg3v3hfg70.cloudfront.net/TB5036/.jpg" alt="AD
Q73: By the time Paul Volcker took office
Q74: How does the aggregate supply curve differ
Q75: 12.2 Equilibrium in Aggregate Demand and Supply
Q77: 12.2 Equilibrium in Aggregate Demand and Supply
Q78: The effect on the aggregate demand curve
Q79: AD - AS Shocks <img src="https://d2lvgg3v3hfg70.cloudfront.net/TB5036/.jpg" alt="AD
Q80: An economy is in long-run equilibrium when
Q81: By the time Paul Volcker took office