Multiple Choice
The accompanying data were compiled by the superintendent of schools in a large metropolitan area. The table shows the average SAT verbal scores of high school seniors during the 5 years since the district implemented its "back-to-basics" program.  Determine the equation of the least-squares line for these data.
A) 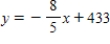
B) 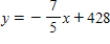
C) 
D) 
E) 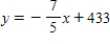
Correct Answer:

Verified
Correct Answer:
Verified
Q190: Determine whether the equation defines y as
Q191: Delivery Charges. A furniture store offers free
Q192: The demand equation for a certain brand
Q193: Draw a scatter diagram for the data
Q194: Find the equation of the least-squares line
Q196: Metro Department Store's annual sales (in millions
Q197: Entomologists have discovered that a linear relationship
Q198: Match each graph below with the letter
Q199: Find the slope of the line shown
Q200: Determine whether the equation defines y as