Multiple Choice
The accompanying table gives the projected online spending per buyer (in dollars) from 2002 (x = 0) through 2008 (x = 6) :  Find an equation of the least-squares line for these data. Use the result to estimate the rate of change of spending per buyer between 2002 and 2008. Round your answers to two decimal places.
A) 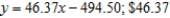
B) 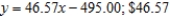
C) 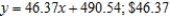
D) 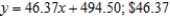
E) 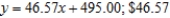
Correct Answer:

Verified
Correct Answer:
Verified
Q5: Find the slope of the line shown
Q6: The quantity demanded of a certain brand
Q7: Refer to the accompanying figure and determine
Q8: Determine whether the equation defines y as
Q9: Entomologists have discovered that a linear relationship
Q11: Which point has coordinates (-5, 4)? <img
Q12: For the pair of supply-and-demand equations, where
Q13: Which point has coordinates (-2, 2)? <img
Q14: If the line passing through the points
Q15: Find an equation of the circle that