Multiple Choice
The Census Bureau projections of male life expectancy at age 65 in the United States are summarized in the following table. 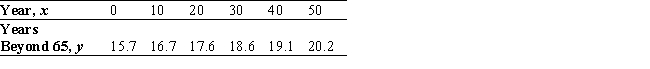 (Here, x = 0 corresponds to the beginning of 2000.) Find the equation of the least-squares line for these data. Use the equation found to estimate the life expectancy at 65 of a male in 2030.
A) y = 0.3x + 10.31; 19 years
B) y = 0.09x + 16; 18 years
C) y = 0.22x + 9.95; 82 years
D) y = 0.3x + 10.31; 84 years
Correct Answer:

Verified
Correct Answer:
Verified
Q121: The relationship between temperature measured in the
Q122: Find the equation of the least-squares line
Q123: Determine whether the statement is true or
Q124: Find the break-even point for the firm
Q125: Minimizing Shipping Costs. Towns A, B, C,
Q127: If the line passing through the points
Q128: If the line passing through the points
Q129: Find the equation of the least-squares line
Q130: The accompanying data were compiled by the
Q131: A product may be made using machine