Multiple Choice
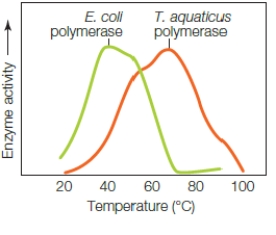 The graph above shows the temperature profile for T.aquaticus polymerase,an enzyme used by a species of bacteria that lives in hot springs.What does the boxed region indicate?
A) The enzyme activity increases as substrates increase their kinetic energy.
B) The enzyme activity decreases as substrates increase their kinetic energy.
C) The enzyme activity increases as the enzyme denatures.
D) The enzyme activity decreases as the enzyme denatures.
E) The enzyme activity decreases as the enzyme refolds.
Correct Answer:

Verified
Correct Answer:
Verified
Q8: <img src="https://d2lvgg3v3hfg70.cloudfront.net/TB5951/.jpg" alt=" In the figure
Q10: Enzymes speed up a chemical reaction by
Q11: <img src="https://d2lvgg3v3hfg70.cloudfront.net/TB5951/.jpg" alt=" Based on
Q51: In a chemical reaction, if the reactants
Q53: Cells store energy in the form of
Q54: Wilting of a plant occurs _.<br>A) if
Q55: The fact that the earth does not
Q59: Active transport pumps typically move solutes from
Q68: Which human organ is responsible for breaking
Q71: Movement of substances that requires the expenditure