Essay
Use the graphical approach to CVP analysis to solve the following problem.
Valley Peat Ltd. sells peat moss for $10 per bag. Variable costs are $7.50 per bag and annual fixed costs are $100,000.
a) How many bags of peat must be sold to break even?
b) What will be the net income for a year in which 60,000 bags of peat are sold?
c) How many bags must be sold for a net income of $60,000 in a year?
d) What volume of sales would produce a loss of $10,000? 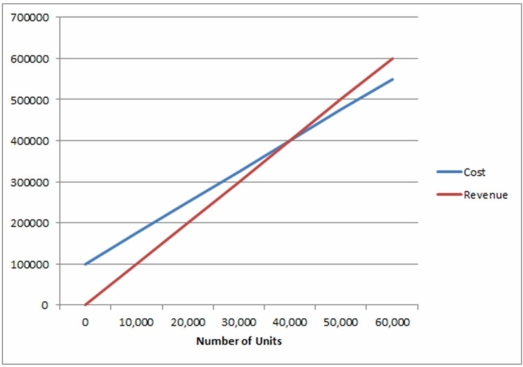
Correct Answer:

Verified
Correct Answer:
Verified
Q1: Reflex Manufacturing Corp. manufactures composters at a
Q6: Dynacan Ltd. manufactured 10,000 units of product
Q7: The current annual budget for Armstrong Ltd.
Q8: Memex Corp. manufactures memory expansion boards for
Q11: Sam manufactures a product that is selling
Q16: A small company can produce 500 dolls
Q30: The Kelowna division of Windstream RVs builds
Q33: The selling price of a widget is
Q41: The selling price of a widget is
Q43: Kuldip's factory manufactures toys that sell for