Essay
A quality analyst wants to construct a sample mean chart for controlling a packaging process.He knows from past experience that when the process is operating as intended,packaging weight is normally distributed with a mean of twenty ounces,and a process standard deviation of two ounces.Each day last week,he randomly selected four packages and weighed each.The data from that activity appear below.
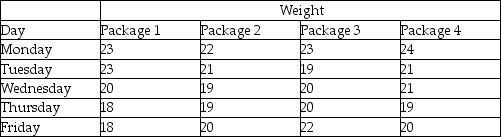 (a)If he sets an upper control limit of 21 and a lower control limit of 19 around the target value of twenty ounces,the control chart is based on what value of z?
(b)With the UCL and LCL of part a,what do you conclude about this process-is it in control?
Correct Answer:

Verified
(a)These control limits are one standard...View Answer
Unlock this answer now
Get Access to more Verified Answers free of charge
Correct Answer:
Verified
View Answer
Unlock this answer now
Get Access to more Verified Answers free of charge
Q20: If a process has only natural variations,_
Q43: A process range chart illustrates the amount
Q57: The causes of variation in statistical process
Q72: Pierre's Motorized Pirogues and Mudboats is setting
Q75: Cartons of Plaster of Paris are supposed
Q100: A manager wishes to build a 3-sigma
Q111: A process that is in statistical control
Q163: A c-chart is appropriate to plot the
Q168: Mistakes stemming from workers' inadequate training represent
Q220: Statistical process control charts:<br>A) display the measurements