Essay
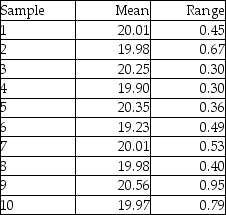
Ten samples of size four were taken from a process,and their weights measured.The sample averages and sample ranges are in the following table.Construct and plot an x-bar and R-chart using these data.Is the process in control?
Correct Answer:

Verified
 The x-bar chart is out of co...
View Answer
Unlock this answer now
Get Access to more Verified Answers free of charge
Correct Answer:
Verified
View Answer
Unlock this answer now
Get Access to more Verified Answers free of charge
Q19: A woodworker is concerned about the quality
Q40: If a sample of items is taken
Q45: What are the three possible results (or
Q54: Mean charts and range charts complement one
Q94: Examine the Statistical Process Control outputs below.Answer
Q95: Larry's boat shop wants to monitor the
Q130: A manufacturer uses statistical process control to
Q132: Acceptance sampling is usually used to control:<br>A)the
Q213: The width of a bronze bar is
Q227: According to the text, what is the