Essay
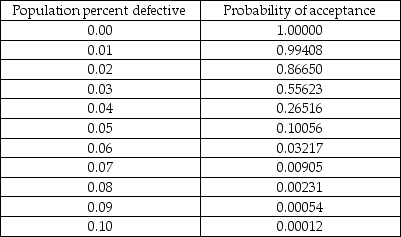
In the table below are selected values for the OC curve for the acceptance sampling plan n=210,c=6.Upon failed inspection,defective items are replaced.Calculate the AOQ for each data point.(You may assume that the population is much larger than the sample. )Plot the AOQ curve.At approximately what population defective rate is the AOQ at its worst? Explain how this happens.How well does this plan meet the specifications of AQL = 0.015,α = 0.05;LTPD = 0.05,β=0.10? Discuss.
Correct Answer:

Verified
The plan meets the α...View Answer
Unlock this answer now
Get Access to more Verified Answers free of charge
Correct Answer:
Verified
View Answer
Unlock this answer now
Get Access to more Verified Answers free of charge
Q39: The mean and standard deviation for a
Q48: Acceptance sampling:<br>A)may involve inspectors taking random samples
Q52: What is the difference between the process
Q60: Which of the following is true about
Q119: The statistical definition of Six Sigma allows
Q121: Natural variations:<br>A) are variations that are to
Q125: The steeper an OC curve,the better it
Q130: If μ = 9 ounces, σ =
Q150: An operating characteristic (OC) curve describes<br>A) how
Q168: Mistakes stemming from workers' inadequate training represent