Essay
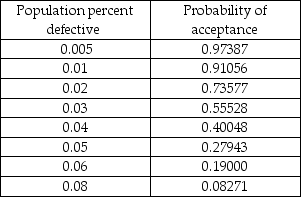
In the table below are selected values for the OC curve associated with the acceptance sampling plan n = 50,c = 1.(Watch out-the points are not evenly spaced. )Assume that upon failed inspection,defective items are replaced.Calculate the AOQ for each data point.(You may assume that the population is much larger than the sample. )Plot the AOQ curve.At approximately what population defective rate is the AOQ at its worst? Explain how this happens.How well does this plan meet the specifications of AQL = 0.0050,α = 0.05;LTPD = 0.05,β = 0.10? Discuss.
Correct Answer:

Verified
This plan does not meet the sp...View Answer
Unlock this answer now
Get Access to more Verified Answers free of charge
Correct Answer:
Verified
View Answer
Unlock this answer now
Get Access to more Verified Answers free of charge
Q32: Average outgoing quality (AOQ) usually<br>A) worsens with
Q51: A retail store manager is trying to
Q55: Which of the following is true regarding
Q111: A process that is in statistical control
Q119: Some degree of variability is present in
Q125: Jars of pickles are sampled and weighed.Sample
Q127: A small,independent amusement park collects data on
Q128: The statistical process chart used to control
Q153: A process that is assumed to be
Q163: A c-chart is appropriate to plot the