Essay
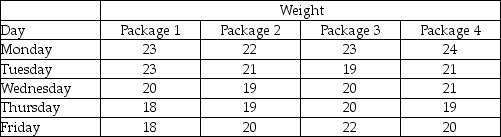
A quality analyst wants to construct a sample mean chart for controlling a packaging process.He knows from past experience that when the process is operating as intended,packaging weight is normally distributed with a mean of twenty ounces,and a process standard deviation of two ounces.Each day last week,he randomly selected four packages and weighed each.The data from that activity appear below.
 (a)If he sets an upper control limit of 21 and a lower control limit of 19 around the target value of twenty ounces,the control chart is based on what value of z?
(b)With the UCL and LCL of part a,what do you conclude about this process-is it in control?
Correct Answer:

Verified
(a)These control limits are one standard...View Answer
Unlock this answer now
Get Access to more Verified Answers free of charge
Correct Answer:
Verified
View Answer
Unlock this answer now
Get Access to more Verified Answers free of charge
Q47: Pierre's Motorized Pirogues and Mudboats is setting
Q48: Acceptance sampling:<br>A)may involve inspectors taking random samples
Q50: Consumer's risk is the probability of:<br>A)accepting a
Q52: What is the difference between the process
Q53: A Cpk index greater than _ is
Q58: The x-bar chart, like the c-chart, is
Q104: The _ is a quality control chart
Q140: A lot that is accepted by acceptance
Q171: Under which of the following situations will
Q230: An x-bar control chart was examined and