Essay
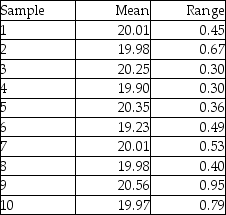
Ten samples of size four were taken from a process,and their weights measured.The sample averages and sample ranges are in the following table.Construct and plot an x-bar and R-chart using these data.Is the process in control?
Correct Answer:

Verified
 The x-bar chart is out of co...
View Answer
Unlock this answer now
Get Access to more Verified Answers free of charge
Correct Answer:
Verified
View Answer
Unlock this answer now
Get Access to more Verified Answers free of charge
Q20: If a process has only natural variations,_
Q21: Red Top Cab Company receives multiple complaints
Q23: The probability of rejecting a good lot
Q24: An operator trainee is attempting to monitor
Q26: McDaniel Shipyards wants to develop a control
Q28: A Type II error occurs when:<br>A)a good
Q30: A retail store manager is trying to
Q102: A city police chief decides to do
Q147: Control charts for variables are based on
Q213: The width of a bronze bar is