Not Answered
Given the following graphs, which graph represents fixed costs? 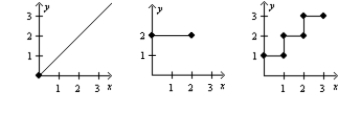

Correct Answer:

Verified
Correct Answer:
Verified
Related Questions
Q18: Total costs may be computed as follows:<br>A)
Q56: The _ method may be used to
Q59: When a firm acquires the resources needed
Q62: Figure 3-9<br>Hereford Company is planning to introduce
Q66: Figure 3-8<br>The following computer printout estimated overhead
Q67: The costs incurred that provide long-term activity
Q69: Mixed costs, by definition, contain both<br>A) product
Q80: A number of cost behavior patterns do
Q158: If a company changes from skilled labor
Q166: Which of the following is an advantage