Multiple Choice
The following diagram is a cost-volume-profit graph for a manufacturing company: 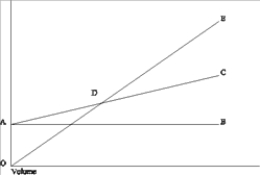 The difference between line AB and line AC (area BAC) is the
A) contribution ratio.
B) total variable cost.
C) contribution margin per unit.
D) total fixed cost.
Correct Answer:

Verified
Correct Answer:
Verified
Q12: The Mildmanner Corporation has the following data
Q12: Bugatti, Inc. decided to institute an advertising
Q13: The DesMaris Company had the following income
Q14: ChowMein Company is the exclusive Montana distributor
Q15: Hologram Printing Company projected the following information
Q18: The break-even point in units can be
Q19: Symbiosis Company had the following information: <img
Q21: The income statement for Symbiosis Manufacturing Company
Q22: In a cost-volume-profit graph, the total revenue
Q26: The break-even point is the point where