Essay
A quality analyst wants to construct a sample mean chart for controlling a packaging process.He knows from past experience that the process standard deviation is two ounces.Each day last week,he randomly selected four packages and weighed each.The data from that activity appear below.
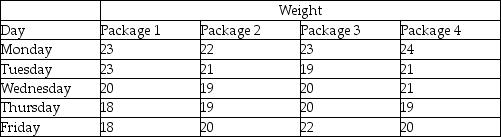 (a)Calculate all sample means and the mean of all sample means.
(b)Calculate upper and lower 2-sigma x-bar chart control limits that allow for natural variations.
(c)Based on the x-bar chart,is this process in control?
Correct Answer:

Verified
(a)The five sample means are 23,21,20,19...View Answer
Unlock this answer now
Get Access to more Verified Answers free of charge
Correct Answer:
Verified
View Answer
Unlock this answer now
Get Access to more Verified Answers free of charge
Q10: The defect rate for a product has
Q23: The probability of rejecting a good lot
Q36: At your first job out of college
Q40: Cartons of Plaster of Paris are supposed
Q180: The acceptable quality level (AQL) is the
Q202: The _ is the lowest level of
Q212: What four elements determine the value of
Q213: The width of a bronze bar is
Q220: Statistical process control charts:<br>A) display the measurements
Q256: A p-chart is appropriate to plot the