Essay
A quality analyst wants to construct a sample mean chart for controlling a packaging process.He knows from past experience that when the process is operating as intended,packaging weight is normally distributed with a mean of twenty ounces,and a process standard deviation of two ounces.Each day last week,he randomly selected four packages and weighed each.The data from that activity appear below.
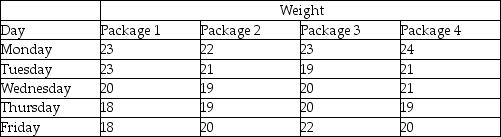 (a)If he sets an upper control limit of 21 and a lower control limit of 19 around the target value of twenty ounces,the control chart is based on what value of z?
(b)With the UCL and LCL of part a,what do you conclude about this process-is it in control?
Correct Answer:

Verified
(a)These control limits are one standard...View Answer
Unlock this answer now
Get Access to more Verified Answers free of charge
Correct Answer:
Verified
View Answer
Unlock this answer now
Get Access to more Verified Answers free of charge
Q50: Consumer's risk is the probability of:<br>A)accepting a
Q74: Which of the following is true regarding
Q87: In statistical process control,the range is often
Q121: Natural variations:<br>A) are variations that are to
Q130: If the Cpk index exceeds 1:<br>A)the AQL
Q132: Acceptance sampling is usually used to control:<br>A)the
Q132: What is the basic objective of a
Q157: What does it mean for a process
Q231: The _ is the percentage defective in
Q254: The upper and lower limits for diving