Multiple Choice
The following table shows the probability of demand for automobiles used in an Excel simulation. 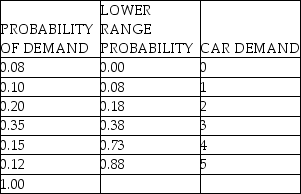 The "= RAND() " function results in a random number for week #1 of 0.2239.The "= VLOOKUP" function is used with the table above to generate a random car demand for week #1.The resulting random car demand for this week is:
A) 1 car.
B) 2 cars.
C) 3 cars.
D) 4 cars.
Correct Answer:

Verified
Correct Answer:
Verified
Q10: Scenario E.1<br>SimQuick is being used to simulate
Q17: A simulation model:<br>A) describes operating characteristics with
Q18: If the data needed to set up
Q30: A simulation model is used to test
Q34: To generate 80 random numbers in an
Q37: On occasion,a simulation may yield results that
Q38: A statistically significant difference in simulation results,when
Q39: A manager has been given the table
Q42: The following table shows the probability of
Q46: Scenario E.1<br>SimQuick is being used to simulate