Multiple Choice
Use the data and graph shown below for the following questions. 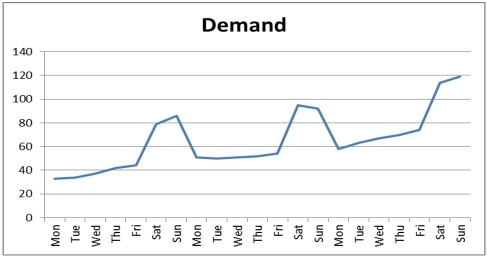
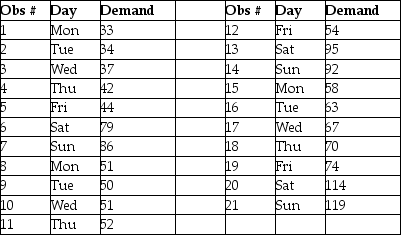
-Refer to the instruction above.Which term most accurately describes the data points associated with Saturdays and Sundays?
A) nonbase data
B) outliers
C) seasons
D) erroneous
Correct Answer:

Verified
Correct Answer:
Verified
Q26: The causal method of forecasting uses historical
Q40: Which one of the following statements about
Q51: What is the difference between mean absolute
Q55: The dispersion of forecast errors is measured
Q98: _ is a causal method of forecasting
Q119: Aggregating products or services together generally decreases
Q134: The Delphi method of forecasting is useful
Q155: A(n)_ is a measure that indicates whether
Q157: Forecasting is a(n)_ that should continually be
Q158: Table 14.13<br>The manager of a pizza shop