Multiple Choice
Use the data and graph shown below for the following questions. 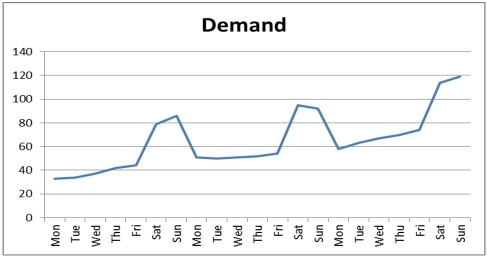
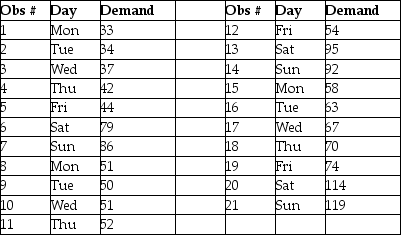
-Refer to the instruction above.What is the average seasonal index for the Sundays in the data set?
A) 0.65
B) 0.67
C) 1.49
D) 1.54
Correct Answer:

Verified
Correct Answer:
Verified
Related Questions
Q2: A bias error results from unpredictable factors
Q19: Which statement about forecast accuracy is TRUE?<br>A)A
Q24: Forecast error is found by subtracting the
Q40: Table 14.13<br>The manager of a pizza shop
Q41: Table 14.2<br>A textbook publisher for books used
Q43: When a significant trend is present,exponential smoothing
Q49: The judgment methods of forecasting are to
Q53: Explain how the value of alpha affects
Q91: A history file of past demand will
Q115: Table 8.7<br>A sales manager wants to forecast