Multiple Choice
Table 5.2 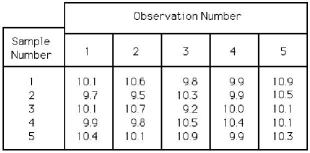
-Using Table 5.2,for the  chart,what is the value of the lower control limit for the x-bar chart?
A) less than or equal to 9.00
B) greater than 9.00 but less than or equal to 9.99
C) greater than 9.99 but less than or equal to 10.99
D) greater than 10.99
Correct Answer:

Verified
Correct Answer:
Verified
Q15: The international standard that is applied to
Q20: A process may be in control according
Q21: The UCL and LCL for an <img
Q22: A company is interested in monitoring the
Q59: The Baldrige Performance Excellence Program:<br>A) focuses on
Q60: Table 5.4<br>The manager of Champion Cooling Company
Q102: The investment a company makes in training
Q149: Financial and market results are one consideration
Q169: Increasing the quality level by better products
Q175: Convicting an innocent defendant is an example