Multiple Choice
A restaurant manager tracks complaints from the diner satisfaction cards that are turned in at each table.The data collected from the past week's diners have been plotted and appear in the following graph.The number of complaints for each category is with each bar. 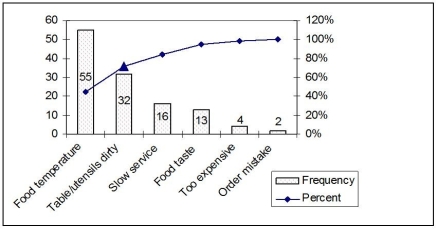 How was the value for the point represented by the triangle calculated?
A) 
B) 
C) 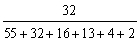
D) 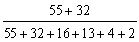
Correct Answer:

Verified
Correct Answer:
Verified
Q32: _ involves estimating the proportion of time
Q57: Highly customized job processes and processes that
Q71: The best data analysis tool for representing
Q73: Gaps between actual and desired performance are
Q74: A simulation model goes one step further
Q78: Scenario 4.2<br>Garman observes a worker assembling peanut
Q80: A major disadvantage of work sampling is
Q157: Develop a process chart for a manual
Q192: Process improvement teams that focus on processes
Q217: If a process under analysis is extensive