Multiple Choice
The following graph shows the demands and marginal revenue in two markets,1 and 2,for a price discriminating firm along with total marginal revenue,MRT,and marginal cost. 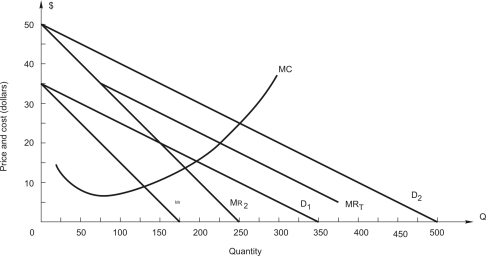 What total output should the firm produce?
A) 275 units
B) 225 units
C) 175 units
D) 350 units
E) 100 units
Correct Answer:

Verified
Correct Answer:
Verified
Q5: In order to maximize profit,a firm that
Q8: The WildTimes Bar offers female patrons a
Q11: firm faces the demand for its product,
Q12: A firm sells its product to two
Q14: Refer to the following: <img src="https://d2lvgg3v3hfg70.cloudfront.net/TB2562/.jpg" alt="Refer
Q15: Drill Quest,Inc.manufactures drill bits for the oil
Q17: A firm sells two goods X and
Q18: Drill Quest,Inc.manufactures drill bits for the oil
Q19: <img src="https://d2lvgg3v3hfg70.cloudfront.net/TB2562/.jpg" alt=" The Hilton Hotel
Q20: firm faces the demand for its product,