Multiple Choice
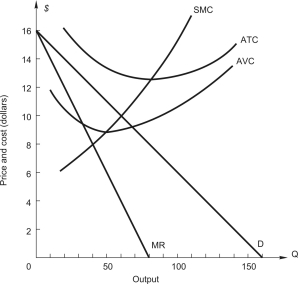 The above graph shows the demand and cost conditions facing a price-setting firm. The firm will produce _____ units of output and charge a price of _____.
A) 40,$8
B) 50,$9
C) 60,$10
D) 50,$6
E) none of the above
Correct Answer:

Verified
Correct Answer:
Verified
Q37: In order to maximize profit,a firm that
Q94: Using time-series data,the demand function for a
Q95: <img src="https://d2lvgg3v3hfg70.cloudfront.net/TB2562/.jpg" alt=" The graph above
Q96: A firm with market power faces the
Q97: Using time-series data,the demand function for a
Q98: <img src="https://d2lvgg3v3hfg70.cloudfront.net/TB2562/.jpg" alt=" The above graph
Q100: firm with market power<br>A)can increase price without
Q101: <img src="https://d2lvgg3v3hfg70.cloudfront.net/TB2562/.jpg" alt=" The graph above
Q103: Columns 1 and 2 make up a
Q104: Using time-series data,the demand function for a