Multiple Choice
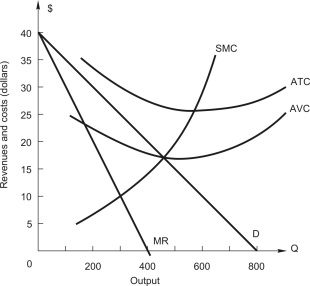 The figure above shows the demand and cost curves facing a price-setting firm.What is marginal revenue when output is 100 units?
A) $10
B) $20
C) $25
D) $30
E) $35
Correct Answer:

Verified
Correct Answer:
Verified
Related Questions
Q4: A monopoly is producing a level of
Q5: A firm with market power is producing
Q46: Using time-series data,the demand function for a
Q47: method of measuring the extent of a
Q48: A manager of a firm with market
Q54: Using time-series data,the demand function for a
Q55: A manager of a firm with market
Q68: A profit-maximizing firm with market power will
Q70: In order to maximize profit,a firm that
Q84: If a monopolist is producing a level