Multiple Choice
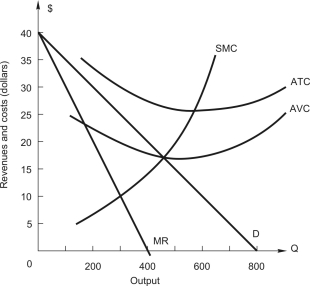 The figure above shows the demand and cost curves facing a price-setting firm.The profit-maximizing or loss-minimizing) level of output is
A) 100
B) 200
C) 300
D) 400
E) 450
Correct Answer:

Verified
Correct Answer:
Verified
Related Questions
Q1: monopolist<br>A)can raise its price without losing any
Q3: A firm with market power faces the
Q5: Refer to the following figure showing demand
Q8: Refer to the following table showing a
Q9: Refer to the following table that gives
Q11: Using time-series data,the demand function for a
Q16: In a monopolistically competitive market,<br>A)a firm has
Q21: Which of the following is true of
Q45: A monopolistically competitive industry is in the
Q74: A monopolist is currently hiring 5,000 units