Multiple Choice
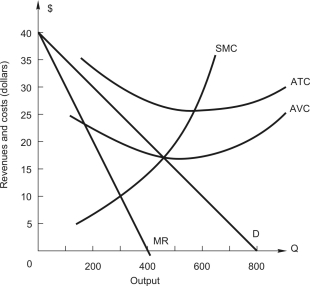 The figure above shows the demand and cost curves facing a price-setting firm.In profit-maximizing or loss-minimizing) equilibrium,the price-setting firm earns $______ in total revenue,which is ___________ the maximum possible total revenue of $________.
A) $7,500; equal to; $7,500
B) $8,000; more than; $7,500
C) $7,650; less than; $8,000
D) $8,000; equal to; $8,000
E) $7,500; less than; $8,000
Correct Answer:

Verified
Correct Answer:
Verified
Q3: A monopolistic competitor is producing a level
Q68: Refer to the following table that gives
Q69: <img src="https://d2lvgg3v3hfg70.cloudfront.net/TB2562/.jpg" alt=" The demand for
Q70: Refer to the following table showing a
Q71: A firm with two plants,A and B,has
Q73: A firm with market power faces the
Q76: <img src="https://d2lvgg3v3hfg70.cloudfront.net/TB2562/.jpg" alt=" The above graph
Q77: If demand is estimated to be <img
Q89: If a monopolistically competitive market is in
Q104: A radio manufacturer has two plants --