Multiple Choice
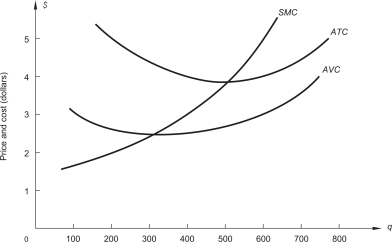 The graph above shows cost curves for a perfectly competitive firm.If market price is $5,how much profit will the firm earn?
A) $600
B) $900
C) $3,000
D) -$600
Correct Answer:

Verified
Correct Answer:
Verified
Related Questions
Q70: A consulting company estimated market demand and
Q71: When a perfect competitive industry is in
Q72: In a competitive market characterized by increasing
Q73: Suppose that a perfectly competitive industry is
Q74: <img src="https://d2lvgg3v3hfg70.cloudfront.net/TB2562/.jpg" alt=" The figure above
Q74: In order to minimize losses in the
Q76: The graph below shows demand and marginal
Q77: Suits Only,a dry cleaning firm that specializes
Q78: To answer the question,refer to the following
Q79: Bartech,Inc.is a firm operating in a competitive