Multiple Choice
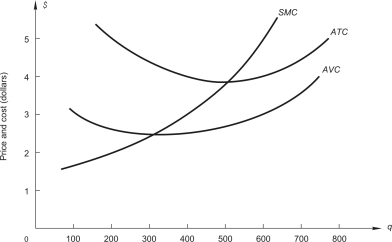 The graph above shows cost curves for a perfectly competitive firm.The firm will break even if price is:
A) $2
B) $3.90
C) $5
D) $6
Correct Answer:

Verified
Correct Answer:
Verified
Related Questions
Q35: Consider a competitive industry and a price-taking
Q36: Below,the graph on the left shows the
Q37: Radon Research Corporation RRC)is one of 24
Q38: Radon Research Corporation RRC)is one of 24
Q39: <img src="https://d2lvgg3v3hfg70.cloudfront.net/TB2562/.jpg" alt=" The graph above
Q41: A consulting company estimated market demand and
Q42: The table below shows a competitive firm's
Q43: An industry is in long-run competitive equilibrium.The
Q44: Suits Only,a dry cleaning firm that specializes
Q45: Consider a competitive industry and a price-taking