Multiple Choice
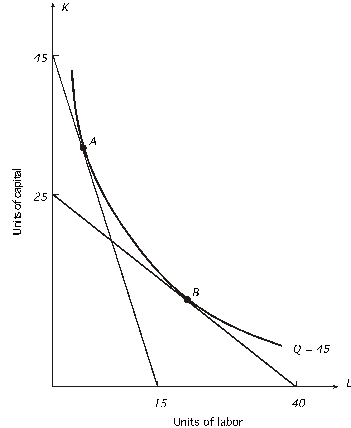 Given the above graph,what is the marginal rate of technical substitution at point A?
A) 0.3
B) 1
C) 1.125
D) 1.67
E) none of the above
Correct Answer:

Verified
Correct Answer:
Verified
Related Questions
Q8: Following is a firm's expansion path.The price
Q10: Which of the following is FALSE?<br>A)A change
Q16: <img src="https://d2lvgg3v3hfg70.cloudfront.net/TB2562/.jpg" alt=" In the above
Q17: In the following graph,the price of capital
Q18: A firm is using 500 units of
Q18: Refer to the following graph.The price of
Q20: producer is hiring 20 units of labor
Q35: In the following graph,the price of capital
Q67: Learning economies differ from economies of scale
Q69: producer is hiring 20 units of labor