Multiple Choice
In the following graph,the price of capital is $100 per unit; the price of labor is $25 per unit.When output is 20 units,what is AVERAGE cost? 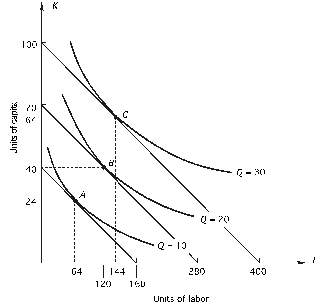
A) $350
B) $700
C) $3,500
D) $7,000
E) none of the above
Correct Answer:

Verified
Correct Answer:
Verified
Q13: Suppose that when a firm increases output
Q62: If a firm is producing the level
Q68: The slope of an isoquant is<br>A)-∆K/∆L.<br>B)MP<sub>L</sub> /
Q71: Following is a firm's expansion path.The price
Q72: Following is a firm's expansion path.The price
Q75: <img src="https://d2lvgg3v3hfg70.cloudfront.net/TB2562/.jpg" alt=" Given the above
Q77: <img src="https://d2lvgg3v3hfg70.cloudfront.net/TB2562/.jpg" alt=" -In the following
Q78: Refer to the following figure.The price of
Q79: In the graph below,the price of capital
Q80: <img src="https://d2lvgg3v3hfg70.cloudfront.net/TB2562/.jpg" alt=" Given the above