Multiple Choice
In the following graph,the price of capital is $100 per unit; the price of labor is $25 per unit.How much does the seventh unit of output add to total cost? 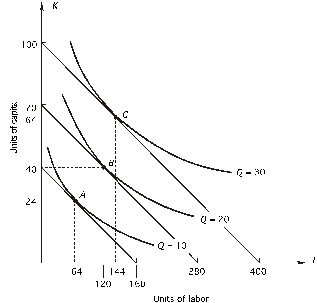
A) nothing
B) $400
C) $800
D) $4,000
E) $8,000
Correct Answer:

Verified
Correct Answer:
Verified
Q10: If the marginal rate of technical substitution
Q15: The marginal rate of technical substitution is<br>A)the
Q42: Refer to the following graph.The price of
Q43: Refer to the following figure.The price of
Q44: <img src="https://d2lvgg3v3hfg70.cloudfront.net/TB2562/.jpg" alt=" In the above
Q45: Refer to the following figure.The price of
Q46: In the following graph,the price of capital
Q49: <img src="https://d2lvgg3v3hfg70.cloudfront.net/TB2562/.jpg" alt=" Given the above
Q50: In the following graph,the price of labor
Q80: expansion path shows how<br>A)input prices change as