Multiple Choice
The following graph shows the marginal and average product curves for labor,the firm's only variable input.The monthly wage for labor is $2,800.Fixed cost is $160,000. 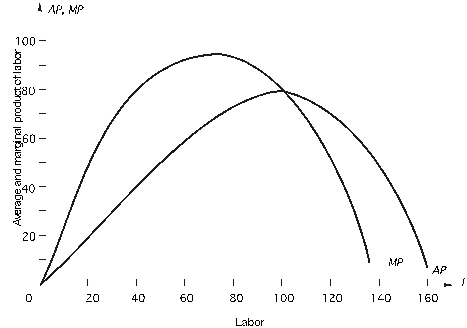 When the firm uses 40 units of labor,what is AVC at this level of output?
A) $120
B) $400
C) $40
D) $70
E) $86
Correct Answer:

Verified
Correct Answer:
Verified
Q11: A fixed cost is<br>A)the cost of any
Q14: The capital stock is fixed at 50
Q15: <img src="https://d2lvgg3v3hfg70.cloudfront.net/TB2562/.jpg" alt=" In the above
Q19: Given the table below,if labor is fixed
Q20: <img src="https://d2lvgg3v3hfg70.cloudfront.net/TB2562/.jpg" alt=" In the figure
Q21: <img src="https://d2lvgg3v3hfg70.cloudfront.net/TB2562/.jpg" alt=" In the table
Q29: For a short-run production function in which
Q45: A firm is using a single variable
Q53: Suppose that the firm's only variable input
Q64: Suppose that the firm's only variable input