Multiple Choice
The following graph shows the marginal and average product curves for labor,the firm's only variable input.The monthly wage for labor is $2,800.Fixed cost is $160,000. 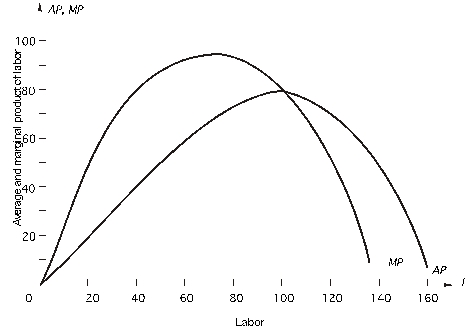 When the firm uses 40 units of labor,what is average total cost at this output?
A) $140
B) $40
C) $70
D) $170
E) none of the above
Correct Answer:

Verified
Correct Answer:
Verified
Q26: <img src="https://d2lvgg3v3hfg70.cloudfront.net/TB2562/.jpg" alt=" In the table
Q27: Use the following table to answer the
Q28: Use the following table to answer the
Q29: If labor is fixed at 5 units,how
Q33: In the table below,the capital stock is
Q34: Based on the following table,what is average
Q35: Based on the following table,what is total
Q41: Diminishing returns refers to the decrease in<br>A)profit
Q46: A firm produces 4,000 units of output
Q68: Average total cost<br>A)increases as output increases.<br>B)decreases as