Multiple Choice
The following graph shows the marginal and average product curves for labor,the firm's only variable input.The monthly wage for labor is $2,800.Fixed cost is $160,000. 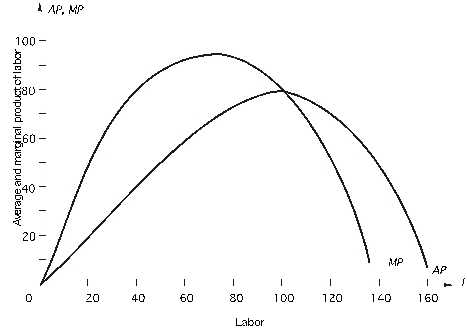 When the firm uses 120 units of labor,what is its AVC at this output?
A) $40
B) $70
C) $60
D) $56
E) none of the above
Correct Answer:

Verified
Correct Answer:
Verified
Q90: out the table and answer the question
Q91: The following graph shows the marginal and
Q92: Given the table below,what is the marginal
Q93: To answer,refer to the following: "Ford built
Q94: The capital stock is fixed at 50
Q95: Fill out the table and answer the
Q96: The following graph shows the marginal and
Q97: Based on the following table,what is average
Q100: The following graph shows the marginal and
Q107: Which of the following statements is FALSE?<br>A)A