Multiple Choice
Use the figure below,which shows a linear demand curve and the associated total revenue curve,to answer the question. 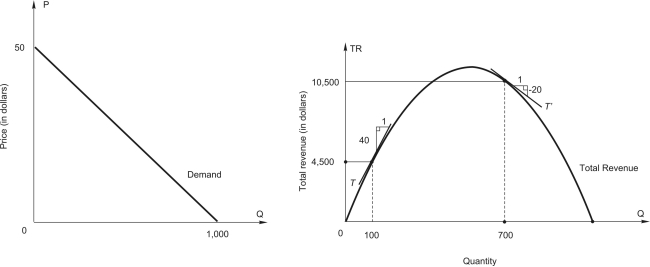 The price for which 100 units can be sold is $_____.
A) 10
B) 15
C) 25
D) 45
E) 50
Correct Answer:

Verified
Correct Answer:
Verified
Q1: When demand is inelastic,<br>A)quantity sold does not
Q36: Interior Department recently announced that it will
Q42: According to the following figure,demand is unitary
Q45: If the price elasticity of demand for
Q48: To answer the question,refer to the following
Q49: When marginal revenue is positive,<br>A)demand is elastic.<br>B)marginal
Q49: Refer to the following graph to answer
Q50: To answer the question,refer to the following
Q52: To answer the question,refer to the following
Q55: E<sub>1</sub> is demand elasticity for Minute Maid