Multiple Choice
Use the figure to calculate the income elasticity of demand when income increases from $25,000 to $30,000: 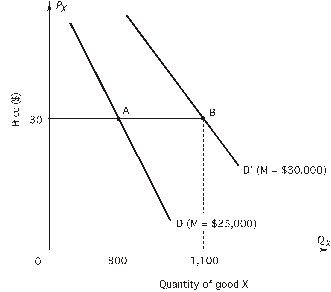
A) -0.10
B) -1.10
C) 0.1818
D) 0.20
E) 1.10
Correct Answer:

Verified
Correct Answer:
Verified
Related Questions
Q7: According to the following figure,the equation for
Q8: the figure below,which shows a linear demand
Q11: Refer to the following figure.When quantity demanded
Q11: The demand for good X will be
Q13: Suppose the demand for good X is
Q14: Refer to the following figure.When quantity demanded
Q15: the figure below,which shows a linear demand
Q16: the figure below,which shows a linear demand
Q17: According to the following figure,marginal revenue is
Q71: If the price elasticity of demand for