Multiple Choice
According to the following graphs,what is  ?
? 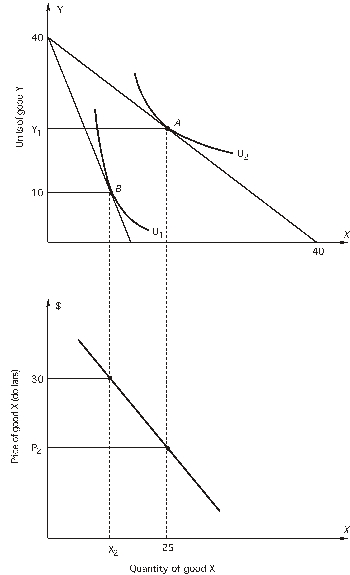 The price of Y is $15 per unit.
A) 10
B) 12
C) 18
D) 20
E) none of the above
Correct Answer:

Verified
Correct Answer:
Verified
Related Questions
Q1: An individual's demand curve for X<br>A)shows how
Q2: The rate at which a consumer is
Q36: The price of X is $20 and
Q38: According to the following figure,what could have
Q39: Assume that an individual consumes two goods,X
Q40: Based on the following graph,what is the
Q42: According to the following graphs,what is <img
Q54: <img src="https://d2lvgg3v3hfg70.cloudfront.net/TB7882/.jpg" alt=" The consumer's income
Q86: If a consumer is choosing the bundle
Q99: <img src="https://d2lvgg3v3hfg70.cloudfront.net/TB7882/.jpg" alt=" -According to the