Multiple Choice
According to the following graphs,what does the curve in the lower graph show? 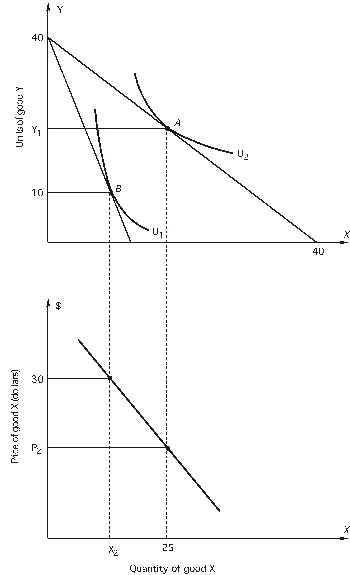 The price of Y is $15 per unit.
A) how a consumer's utility-maximizing choices of X and Y change when the budget constraint changes
B) how a consumer's preferences change when income changes
C) how a consumer's utility-maximizing choices of X changes when the price of X changes
D) how a consumer's utility-maximizing choices of Y changes when the price of Y changes
E) both c and d
Correct Answer:

Verified
Correct Answer:
Verified
Q16: Lord Greystroke uses his limited income to
Q29: Suppose that 25 units of X and
Q42: slope of an indifference curve<br>A)shows the change
Q48: The price of X is $20 and
Q53: Assume that an individual consumes two goods,X
Q55: Refer to the following indifference map for
Q60: The price of X is $20 and
Q61: Alexandra consumes only caviar and champagne,but she
Q61: The price of X is $20 and
Q73: If the marginal rate of substitution of