Multiple Choice
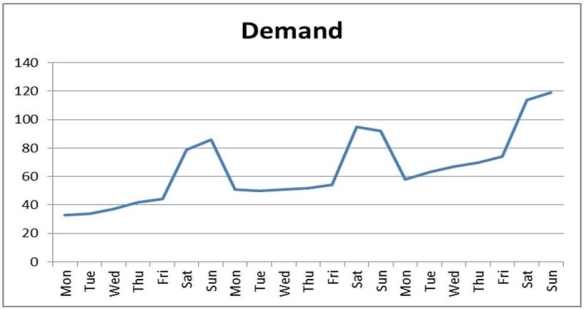
Graph 8.1
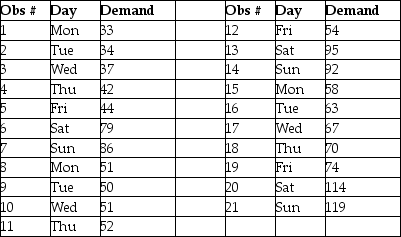
Data plotted in the graph appear in the table below.


-Refer to Graph 8.1. Which term most accurately describes the data points associated with Saturdays and Sundays?
A) nonbase data
B) outliers
C) seasons
D) erroneous
Correct Answer:

Verified
Correct Answer:
Verified
Q115: Table 8.7<br>A sales manager wants to forecast
Q116: Using salesforce estimates for forecasting has the
Q117: Demand for a new five-inch color TV
Q118: Table 8.2<br>The Agricultural Extension Agent's Office has
Q119: Aggregating products or services together generally decreases
Q121: _ methods of forecasting translate the opinions
Q122: With the multiplicative seasonal method of forecasting:<br>A)
Q123: The marketing department for a major manufacturer
Q124: Table 8.3<br>A textbook publisher for books used
Q125: Table 8.5<br> <img src="https://d2lvgg3v3hfg70.cloudfront.net/TB1252/.jpg" alt="Table 8.5