Multiple Choice
Table 5.3
-Four samples of 100 each were taken from an assembly line,with the following results: 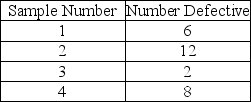 Using the historical average as the central line of the chart,which one of the following is the limit for an attributes control chart with z = 2?
A) UCL > 0.1 and LCL > 0.03
B) UCL > 0.1 and LCL < 0.03
C) UCL < 0.1 and LCL > 0.03
D) UCL < 0.1 and LCL < 0.03
Correct Answer:

Verified
Correct Answer:
Verified
Q86: When is it advantageous to use sampling
Q105: The international standard that is applied to
Q136: Defects are caught and corrected where they
Q140: Which of the following would be considered
Q146: As he entered his broker's office for
Q152: MKS Inc., produces meter sticks that have
Q178: The Baldrige Performance Excellence Program:<br>A) involves a
Q181: Hassan was the company plotter. Give him
Q182: Historically, the average proportion of defective bars
Q191: Use the data in Table 5.4. What