Essay
The management of a line that fills cereal boxes wants the box filled at 32.2 ounces.When the process is in control,the standard deviation is .1 ounces.
a.Construct the upper and lower control limits for a 3-sigma x-bar chart using a sample size of five.
b.The results from the last 10 samples follow.Is the process in control? 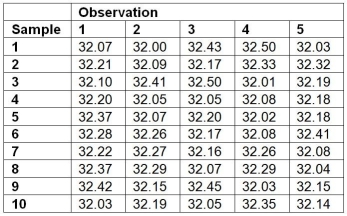
Correct Answer:

Verified
x-bar = 32.2,σ = .1
Control li...View Answer
Unlock this answer now
Get Access to more Verified Answers free of charge
Correct Answer:
Verified
Control li...
View Answer
Unlock this answer now
Get Access to more Verified Answers free of charge
Q43: _ refers to how well the product
Q62: Table 5.4<br>The manager of Champion Cooling Company
Q67: An example of a type I error
Q80: What are the key components of the
Q82: The quality control technician grew weary of
Q119: The upper and lower control limits for
Q133: Regarding control charts, a type I error
Q142: An acceptable quality level is measured as
Q164: _ costs are associated with preventing defects
Q192: In SPC, the distribution of sample means:<br>A)