Essay
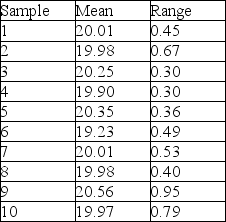
Ten samples of size four were taken from a process,and their weights measured.The sample averages and sample ranges are in the following table.Construct and plot an x-bar and R-chart using this data.Is the process in control?
Correct Answer:

Verified
 The x-bar chart is out of co...
View Answer
Unlock this answer now
Get Access to more Verified Answers free of charge
Correct Answer:
Verified
View Answer
Unlock this answer now
Get Access to more Verified Answers free of charge
Q23: The probability of rejecting a good lot
Q29: What is the AOQ of an acceptance
Q34: Acceptance sampling's primary purpose is to:<br>A) estimate
Q35: Acceptance sampling is usually used to control<br>A)
Q44: Up to three standard deviations above or
Q70: The specification for a plastic handle calls
Q89: A Cp of 1.33 indicates how many
Q121: Averages of small samples,not individual measurements,are generally
Q143: An acceptance sampling plan's ability to discriminate
Q147: An acceptance sampling plan is to be