Essay
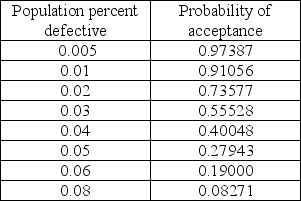
In the table below are selected values for the OC curve associated with the acceptance sampling plan n = 50,c = 1.(Watch out-the points are not evenly spaced. )Assume that upon failed inspection,defective items are replaced.Calculate the AOQ for each data point.(You may assume that the population is much larger than the sample. )Plot the AOQ curve.At approximately what population defective rate is the AOQ at its worst? Explain how this happens.How well does this plan meet the specifications of AQL = 0.0050,α = 0.05;LTPD = 0.05,β = 0.10? Discuss.
Correct Answer:

Verified
This plan does not meet the sp...View Answer
Unlock this answer now
Get Access to more Verified Answers free of charge
Correct Answer:
Verified
View Answer
Unlock this answer now
Get Access to more Verified Answers free of charge
Q32: Average outgoing quality (AOQ) usually<br>A) worsens with
Q54: Mean charts and range charts complement one
Q61: A retail store manager is trying to
Q62: Which of the following statements about acceptance
Q114: The _ are calculated to show how
Q119: Statistical process control charts<br>A) display the measurements
Q119: The statistical definition of Six Sigma allows
Q122: McDaniel Shipyards wants to develop control charts
Q125: The steeper an OC curve,the better it
Q128: A small,independent amusement park collects data on