Essay
Figure Q10-7 shows data from one of the first experiments demonstrating LTP by Bliss and Lomo (1973). The arrows indicate points at which high frequency stimuli were given. 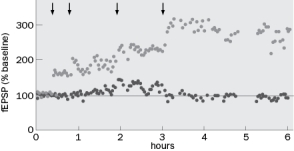 Figure
A. Figure Q10-7A below depicts an example of a field EPSP prior to high frequency stimulation. The vertical line is the stimulus artifact. What would the fEPSP look like at 1 hour and 4 hours? 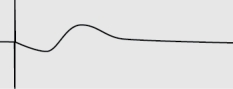 Figure Q10-7A
B. What would happen to the response if Bliss and Lomo had given a low frequency stimulation of about 1 Hz at 5 hours?
Question 10-8 and 10-9 refer to (Figure Q10-8) below. Figure Q10-8 shows a synaptic matrix, which describes how changes in synaptic weight can contribute to memory storage. There are presynaptic inputs A-E and postsynaptic outputs I-IV. 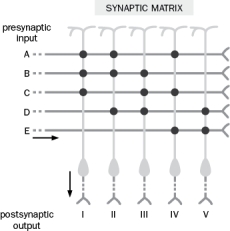 Figure
Correct Answer:

Verified
The fEPSP would be about twice as large ...View Answer
Unlock this answer now
Get Access to more Verified Answers free of charge
Correct Answer:
Verified
View Answer
Unlock this answer now
Get Access to more Verified Answers free of charge
Q26: What is synaptic plasticity?
Q27: For the left graph, rats were given
Q28: How is LTD generated? Choose all that
Q29: The amnesic patient, H.M., lost the ability
Q30: The hippocampus is not essential for long-term
Q32: Figure Q10-21 demonstrates spike-timing dependent activity. <img
Q33: Early experiences can shape neuronal circuitry and
Q34: What is the basic circuitry of the
Q35: Which is an example of associativity? Select
Q36: Why was AP5 applied while the neuron